 ClearNative
Compare four fictional chart scenarios
These images were generated in the actual CandleCanvas app using four different trend presets. They demonstrate visual options for lessons, slides and storyboards, not trading signals. Each example uses a different seed and some use different volatility settings, so this is a collection of scenarios rather than a controlled comparison of a single variable.
Rising: LUMA
This selected simulated scenario rises from an opening price of 142 to a final close of 425.45, roughly tripling across the illustrated span. Use the cyan and pink palette for a pronounced fictional rally in a wide slide. MA5, MA10 and volume give the audience details to discuss without claiming to show a real company’s history.
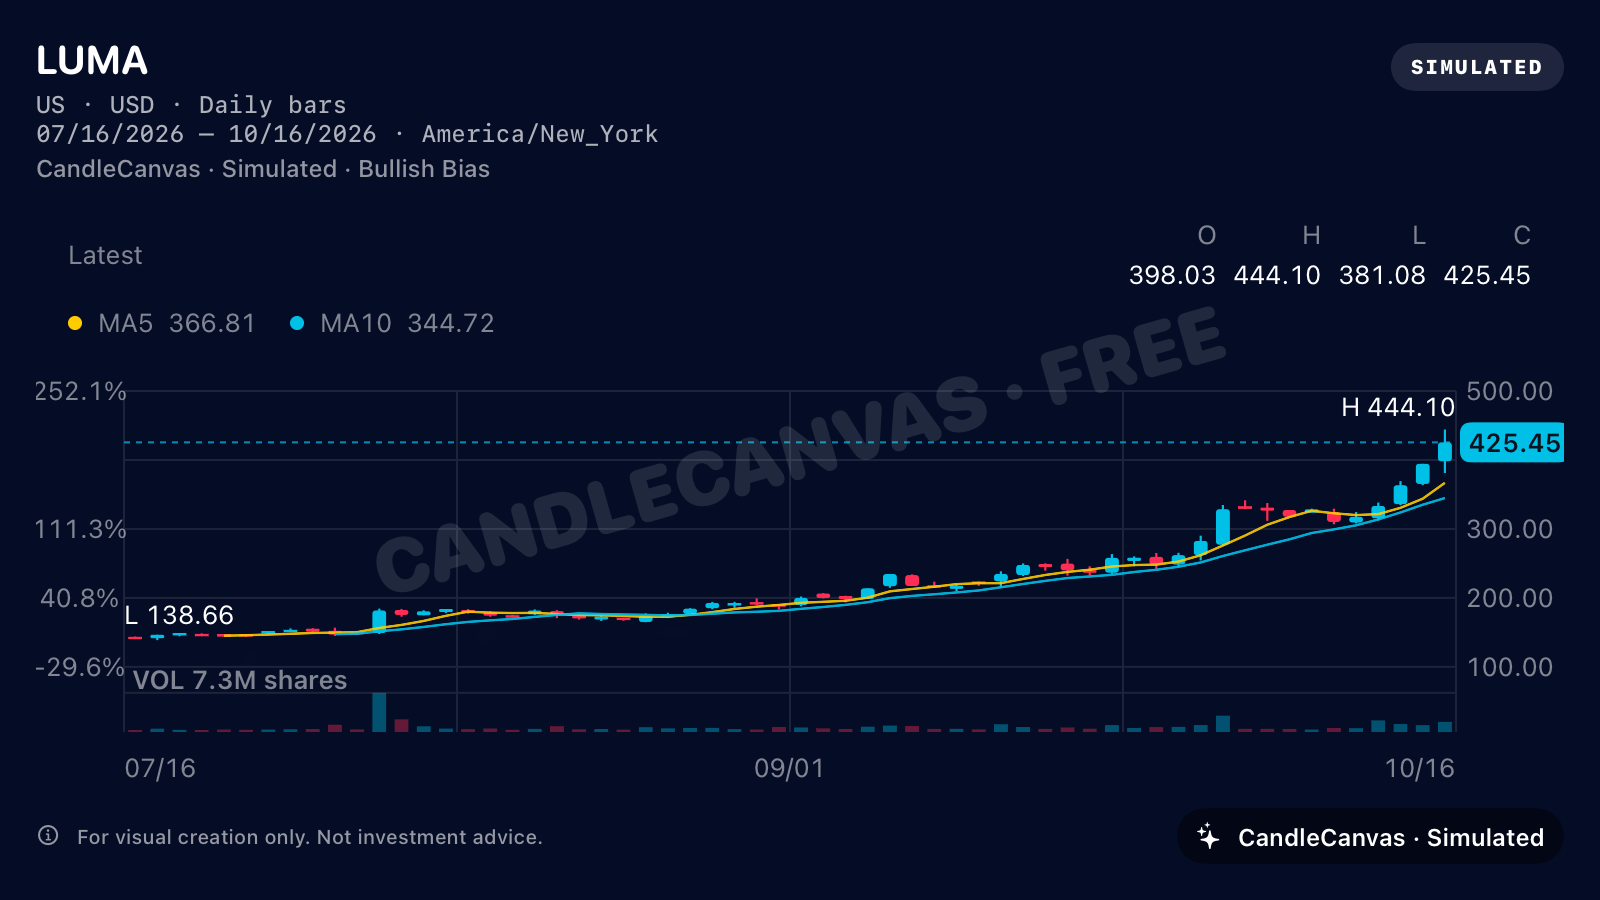
- Trend
- Rising
- Colours
- Cyan up, pink down
- Starting price
- 142
- Volatility
- 3.2
- Moving averages
- MA5 + MA10
- View
- 3M · US market
Falling: NOVA
This selected simulated scenario falls from an opening price of 142 to a final close of 29.19, a decline of about 79.4%. Show how a sharp overall decline can still contain rising candles. Green means a candle closed above its open; red means it closed below. The fictional NOVA series includes both colours within its falling scenario.
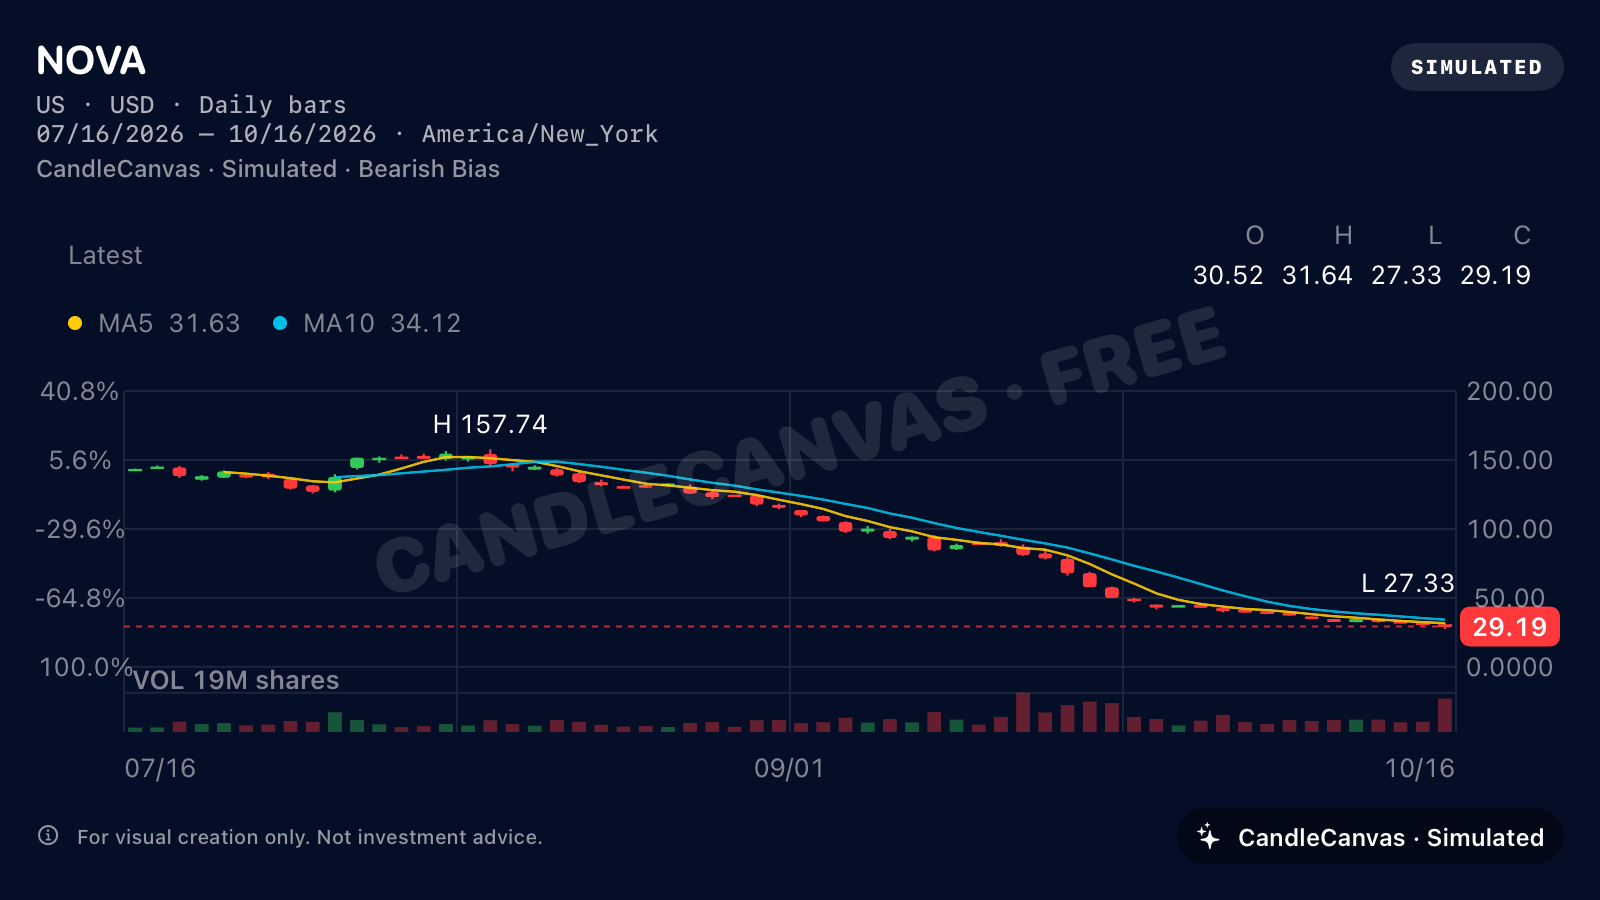
- Trend
- Falling
- Colours
- Green up, red down
- Starting price
- 142
- Volatility
- 3.2
- Moving averages
- MA5 + MA10
- View
- 3M · US market
Sideways: ORBIT
Use the range-bound ORBIT example as a visual asset for a prototype. Its broad swings finish close to the starting level, showing that Sideways does not have to mean a quiet, flat line. The exported PNG is a static image, ready to place in a design file.
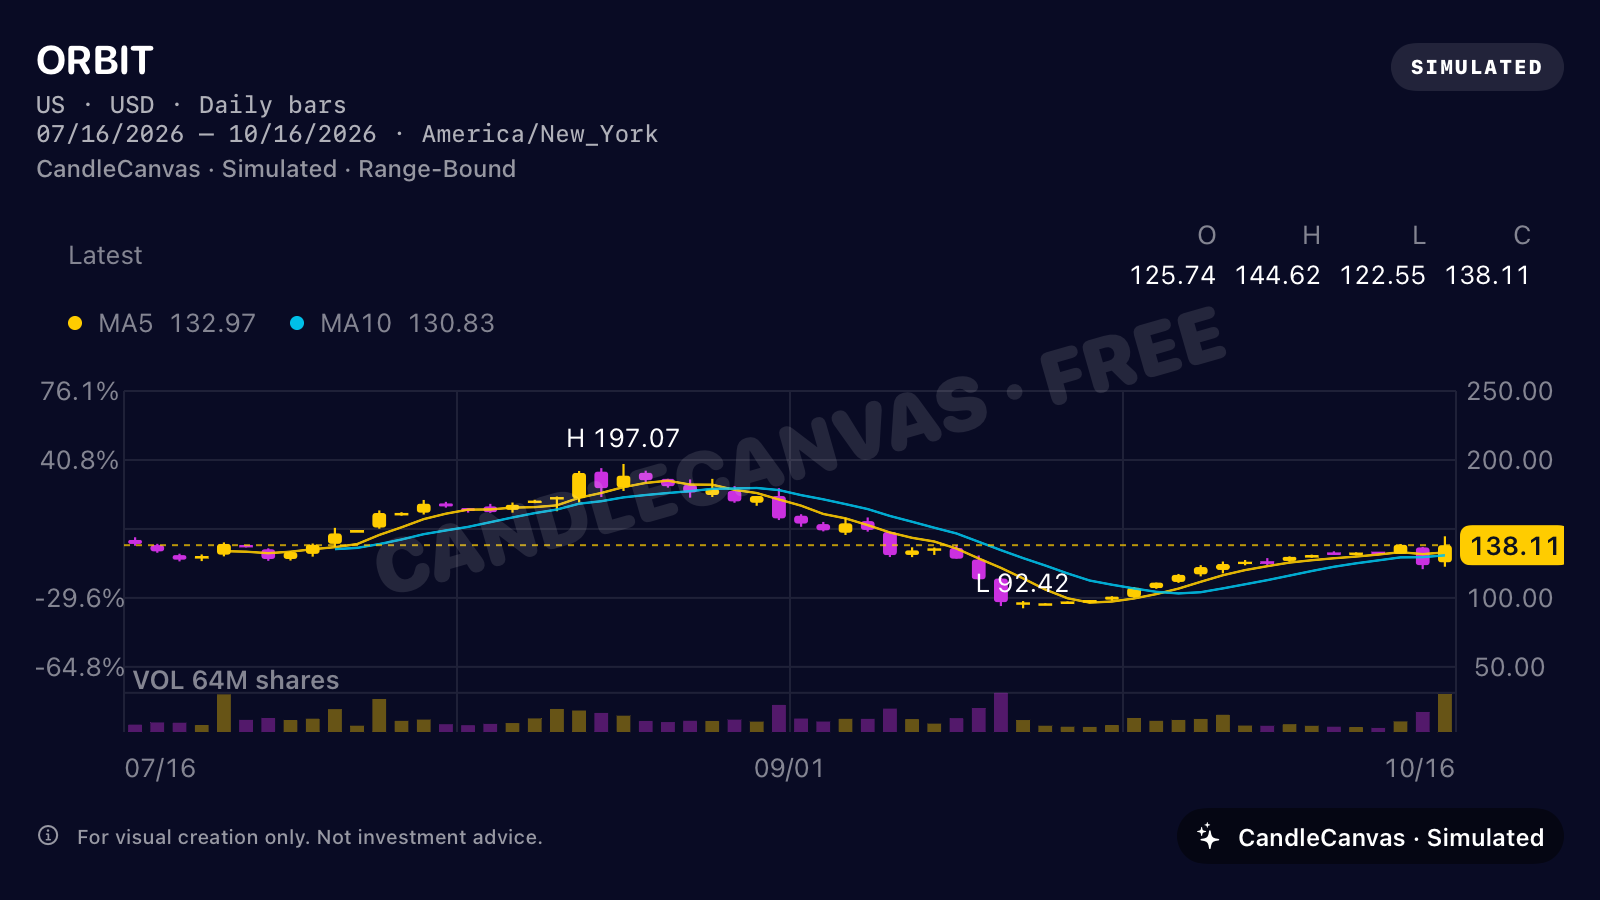
- Trend
- Sideways
- Colours
- Gold up, purple down
- Starting price
- 142
- Volatility
- 2.8
- Moving averages
- MA5 + MA10
- View
- 3M · US market
Reversal: SOL
SOL drops to around 60 before recovering above 170. Use its white and blue candles to illustrate a deep fictional decline followed by a strong rebound. This is an app-generated scenario, not a signal or a claim that a real reversal predicts a future price.
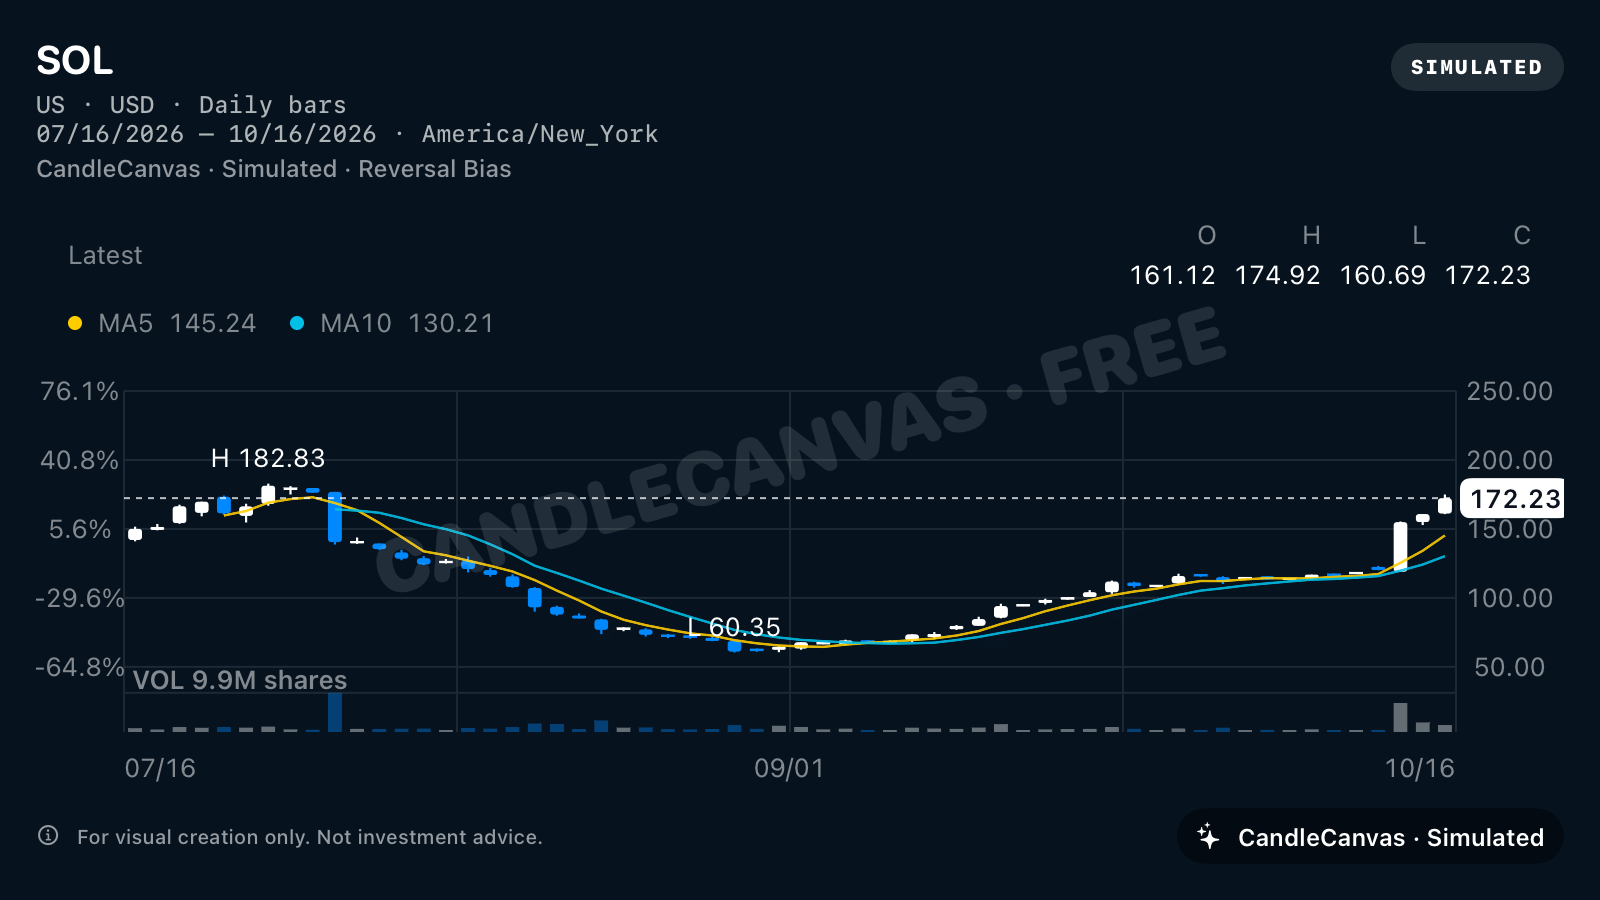
- Trend
- Reversal
- Colours
- White up, blue down
- Starting price
- 142
- Volatility
- 3.2
- Moving averages
- MA5 + MA10
- View
- 3M · US market
Choose a colour convention deliberately
CandleCanvas offers five up/down palettes: red/green, green/red, cyan/pink, gold/purple and white/blue. “Up” and “down” describe a candle’s close relative to its open. A rising overall scenario can contain down candles, and a falling overall scenario can contain up candles.
The EMBER example shows red-up/green-down candles with MA5 and MA10 switched off. That version suits an illustration where bodies and wicks are the main subject.
A lesson about candles, not a forecast
For a basic candle-anatomy lesson, ask the audience to identify the open, close, high and low in a clearly labelled fictional chart. For a storyboard, compare the wider shape across a sequence. Do not use the apparent pattern as evidence of predictive performance.
Each image has its own fitted vertical axis. Compare the numbers and settings as well as the visual slope. See how to create and export a chart for the actual app steps.
Based on CandleCanvas app features and original app exports. All illustrated market data is fictional.